Time in Range: What Your CGM Shows
CGM Time in Range: Targets and Meaning

BBH Physical Health · Diabetes & Blood Sugar · U.S.-first evidence-based CGM education, with UK, Canadian and Australian context
Thank you for reading this post, don't forget to subscribe!A CGM app shows a green circle labeled 72%. What exactly does that mean? It does not mean glucose was perfect all day, that a diabetes diagnosis has changed or that there were no low readings. Time in Range is one part of a larger picture, and understanding the other parts is essential for safe decisions.
This guide explains time in range CGM readings, the ADA 2026 goals, how to understand an Ambulatory Glucose Profile (AGP), and how to identify patterns of highs and lows. U.S. guidance takes priority, with relevant comparisons for the United Kingdom, Canada and Australia.
The aim is practical interpretation rather than encouraging patients to alter medication independently. The most useful report combines the percentage in target, the percentage below and above target, usable sensor data, and individual clinical circumstances.
1. Time in Range CGM: What the Percentage Means
Continuous glucose monitoring, abbreviated CGM, uses a small sensor to estimate glucose in the fluid around cells. It takes frequent measurements during the day and night, creating a pattern rather than a single blood glucose number. Some devices continuously send readings to a phone or receiver; others require a scan.
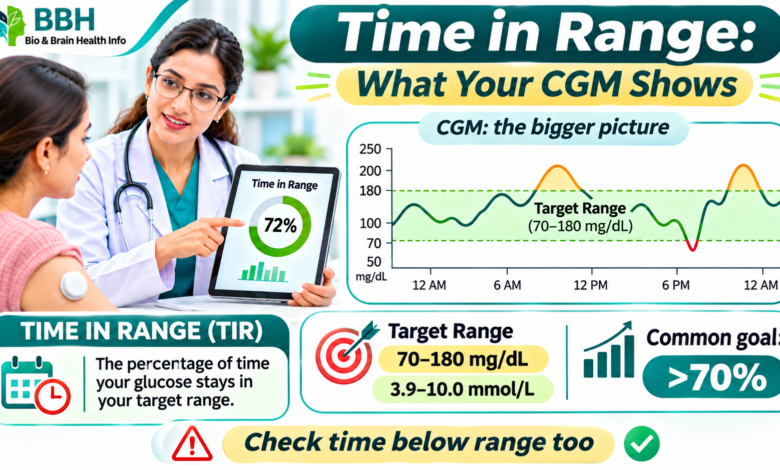
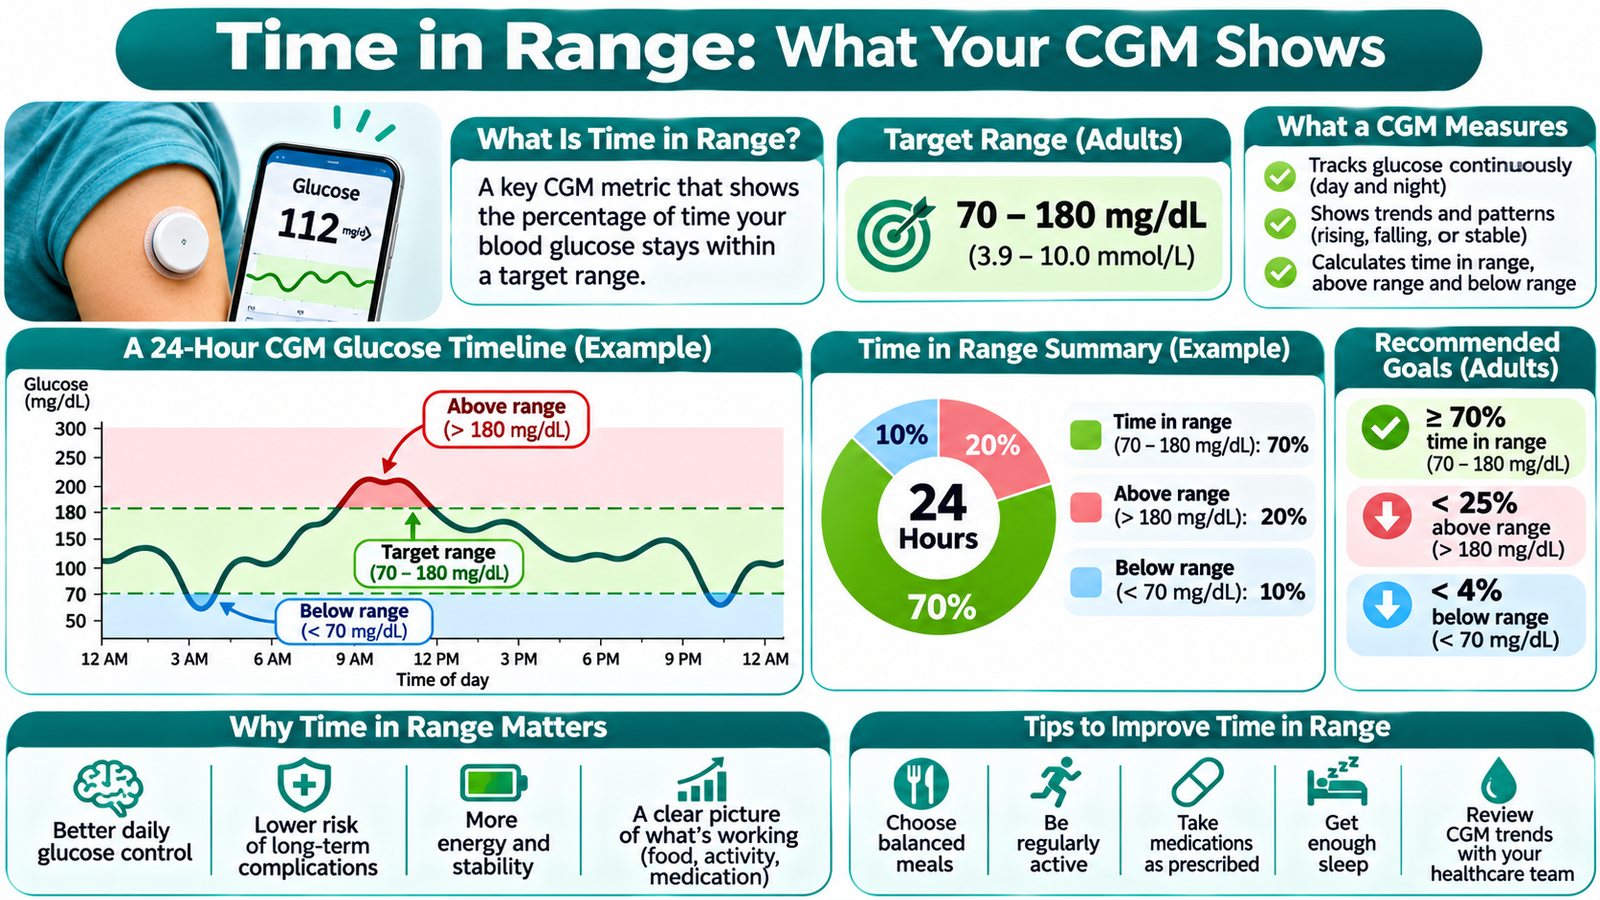
Time in Range, or TIR, is the percentage of valid sensor-monitored time during which glucose stays within a chosen target band. For many nonpregnant adults with type 1 or type 2 diabetes, that band is 70–180 mg/dL (3.9–10.0 mmol/L). The band is a treatment-management reference, not the definition of normal glucose for everyone.
The percentage is useful only alongside other details. A patient with high TIR but frequent glucose readings below 54 mg/dL may still have important safety problems. Likewise, a sensor worn only during part of the day may produce a picture that misses overnight lows.
CGM software often displays the result as a green portion of a circular graphic or as a horizontal band on a trend graph. The presentation may differ by device, but the definition remains a fraction of time in the selected glucose range.
2. Time in Range CGM Targets: ADA 2026
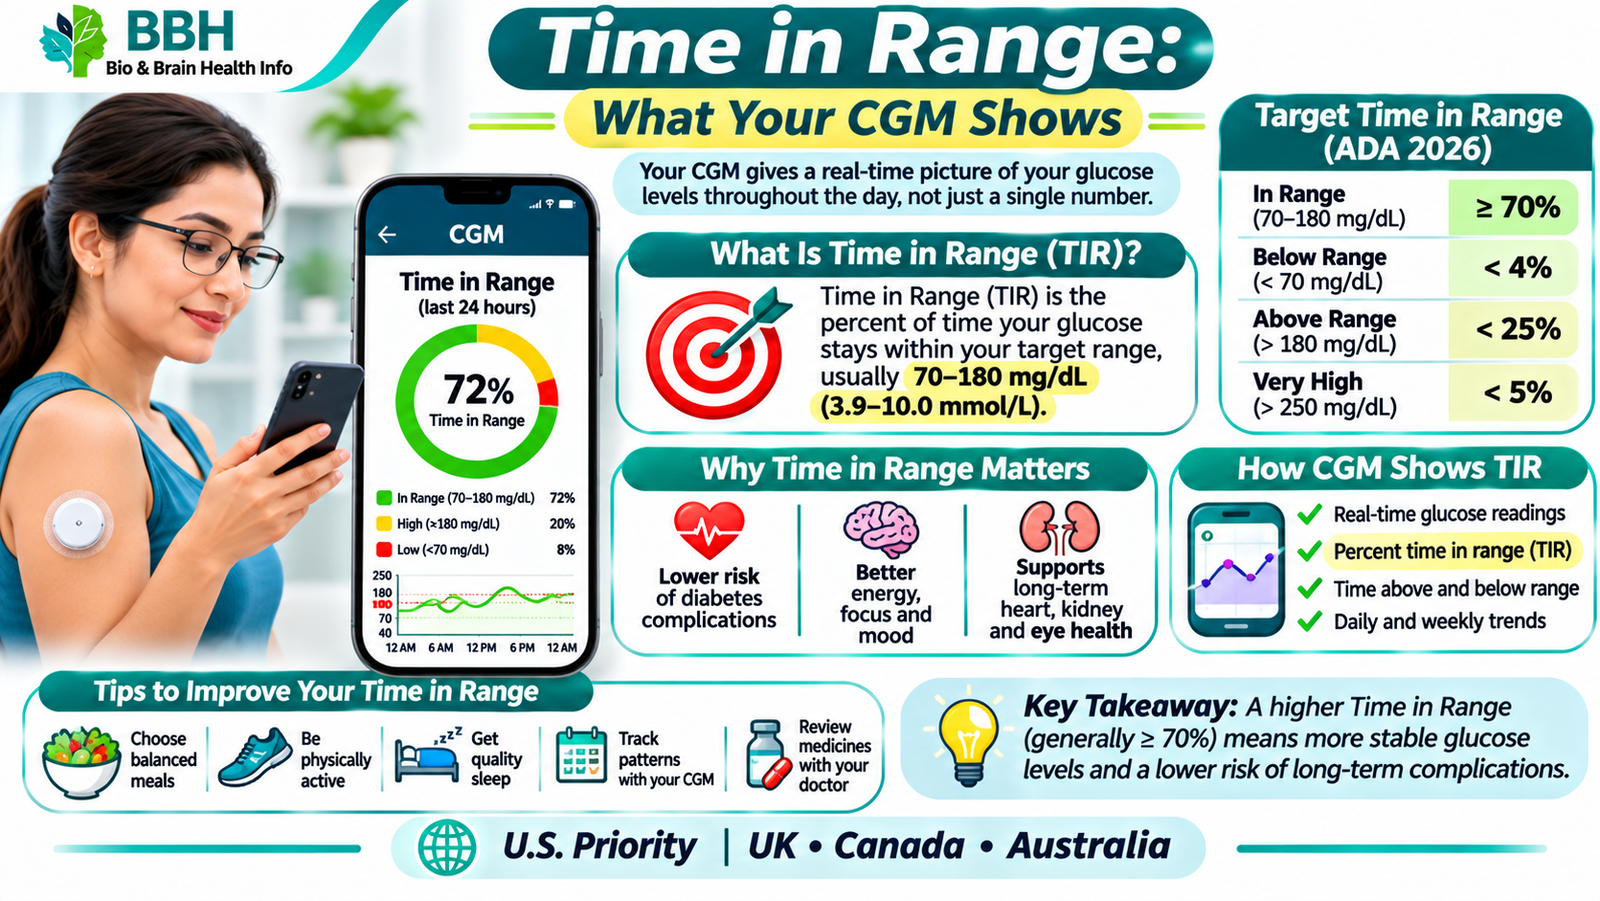
The American Diabetes Association 2026 Standards of Care recommend more than 70% in a glucose range of 70–180 mg/dL for many nonpregnant adults. Accompanying metrics limit high and low exposure. The target should not encourage someone to tolerate more hypoglycemia just to improve an average score.
Typical companion goals include less than 4% below 70 mg/dL, less than 1% below 54 mg/dL, less than 25% above 180 mg/dL and less than 5% above 250 mg/dL. These are widely used adult benchmarks, not universal goals for pregnancy, frailty or complicated health conditions.
| CGM metric | Usual adult glucose band | Common goal |
|---|---|---|
| Time in range | 70–180 mg/dL (3.9–10.0 mmol/L) | >70% |
| Time below range | Below 70 mg/dL (3.9 mmol/L) | <4% |
| Very low | Below 54 mg/dL (3.0 mmol/L) | <1% |
| Time above range | Above 180 mg/dL (10.0 mmol/L) | <25% |
| Very high | Above 250 mg/dL (13.9 mmol/L) | <5% |
| Data coverage | 14-day report | At least 70% active |
At least 70% of sensor information across a 14-day window is generally recommended to make the report more representative. Inadequate wear time or repeated sensor gaps can make a calculated percentage less reliable.
Seventy percent TIR is equivalent to around 16 hours and 48 minutes per day. A percentage can be translated into time, but this should never make low-glucose exposure appear harmless simply because the total number of minutes looks small.
3. How to read your AGP CGM report
The Ambulatory Glucose Profile, often called AGP, summarizes CGM readings over a chosen period, commonly 14 days. It may show the proportion of readings below, within and above target; average glucose; glucose variability; a Glucose Management Indicator; and a graphic representing a typical day.
Begin with data quality. Check the number of days and how frequently the sensor was active. A fourteen-day summary with good coverage is generally more useful than the percentage from a single unusually stressful day.
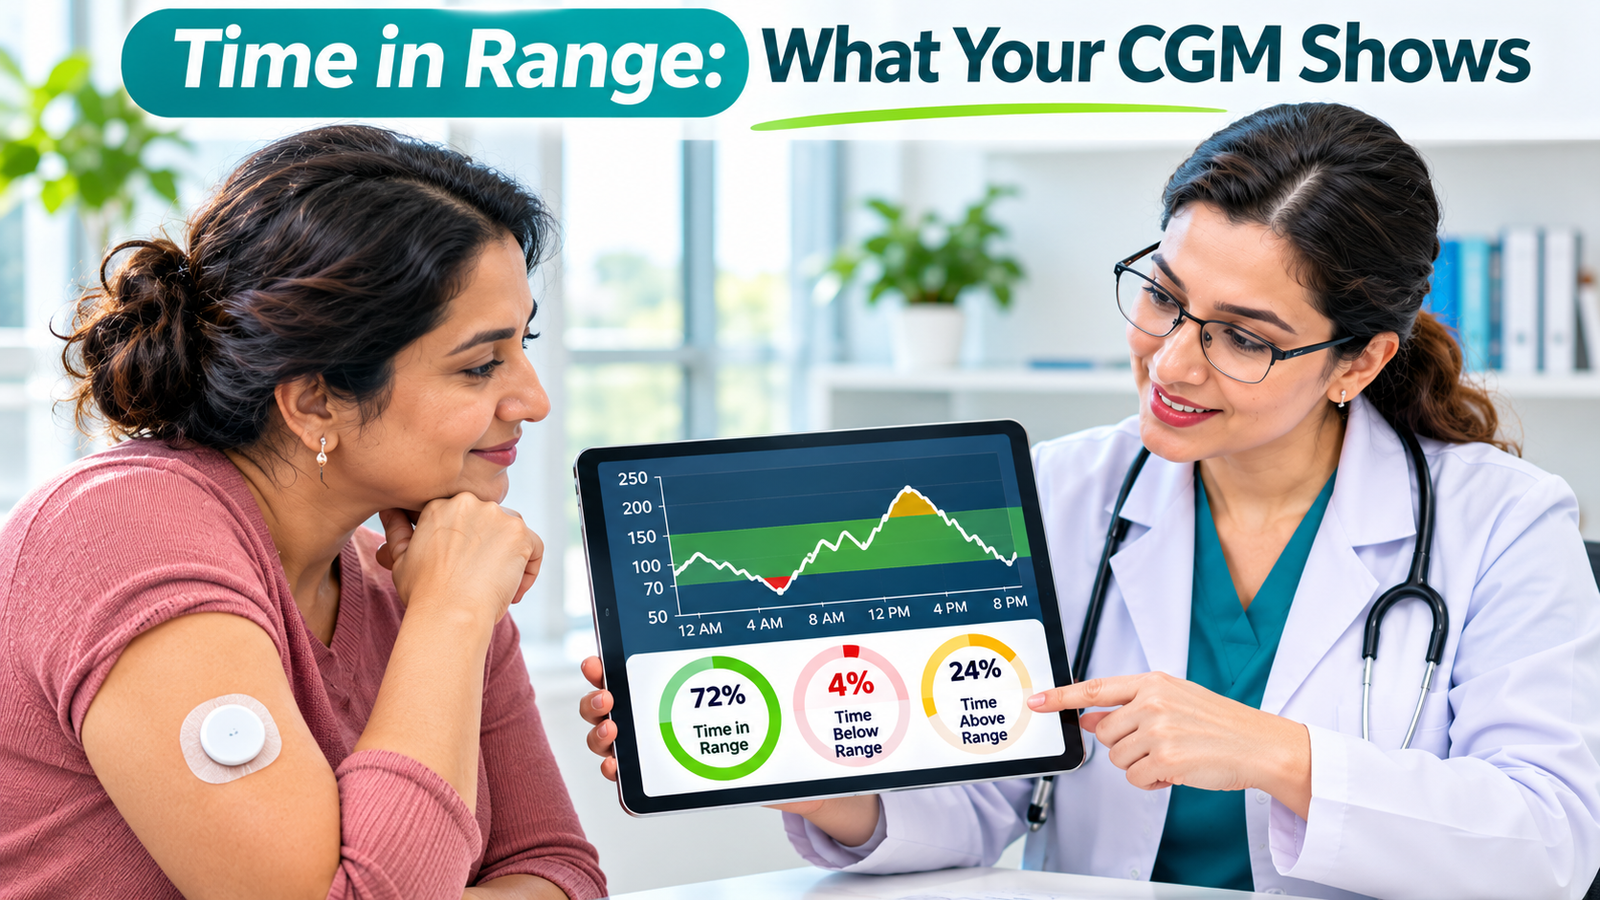
Next, examine Time Below Range before interpreting a strong TIR. Then review high-glucose time and the daily curve for recurring patterns. A low every night and a brief peak after lunch call for different clinical discussions even if two people share the same overall TIR.
The report can suggest when a pattern occurs but cannot prove its cause. Meal timing, activity, insulin, stress, illness and sensor accuracy all need consideration. Ask your diabetes team to review trends rather than changing medicine on the basis of one graph.
When interpreting time in range CGM reports, confirm the target band, low glucose and data coverage before making treatment decisions.
4. Time Below Range: the safety priority
Glucose below 70 mg/dL is a common low-glucose alert threshold; below 54 mg/dL is considered clinically significant. The ADA recommends keeping Time Below Range below both limits as part of safer CGM management.
A hypothetical patient might have 75% in range but 8% below 70 mg/dL. Despite the attractive headline percentage, recurrent hypoglycemia would deserve attention. Check whether lows occur during sleep, after exercise or around medicine administration.
CGM readings can lag blood glucose when levels change quickly. A sensor pressed against bedding may sometimes show a false low. If the display does not match symptoms, follow the device’s guidance about a finger-stick confirmation.
Unconsciousness, seizure or inability to swallow safely requires emergency help. Never give food or drink by mouth to someone who cannot swallow. A caregiver may administer prescribed glucagon according to the emergency plan while arranging urgent assistance.
5. Time Above Range: understanding highs
Time Above Range shows how much of the monitoring period glucose exceeds the target upper boundary, usually 180 mg/dL. Many reports further distinguish values above 250 mg/dL to identify more pronounced hyperglycemia.
Recurring elevations after breakfast could involve meal composition, insulin timing, a high starting value, illness or stress. The CGM pattern does not automatically identify which one is responsible; a professional review is safer than guessing.
Many adults aim for less than 25% above 180 mg/dL and less than 5% above 250 mg/dL. Lower high-glucose exposure should be pursued without increasing the burden of low glucose.
Repeated vomiting, unusual deep breathing, severe dehydration or confusion may indicate a diabetic emergency. Seek urgent medical evaluation; a single CGM number cannot exclude ketoacidosis, particularly in some people taking SGLT2 medicines.
6. An example of a two-week CGM summary
Consider a hypothetical report with 72% in range, 3% below range and 25% above range. Multiplying those percentages by 24 hours gives about 17 hours 17 minutes within the band, 43 minutes below and six hours above on an average day.
Even this tidy summary is incomplete. The time below 54 mg/dL is a separate metric, and it needs to stay under its own guideline threshold. A 3% overall low reading does not tell us whether any of that time was in the very-low category.
Suppose another report shows the same 72% TIR but has a recurring low around 3 a.m. The average score may look identical, yet the nighttime pattern changes what the care team should discuss.
Use a two-week summary rather than assigning moral value to a good or bad day. An illness, travel disruption, sensor detachment or unusual work schedule can distort a shorter time period.
7. Time in Range CGM vs HbA1c and GMI
HbA1c measures glycated hemoglobin and broadly reflects glucose exposure over the previous two to three months. TIR describes how much of a CGM monitoring period falls inside a selected glucose band. Both are valuable but answer different questions.
Two patients can have similar HbA1c values but quite different patterns of high and low glucose. A patient whose average is lowered by frequent severe lows may need a safety-focused review even when HbA1c appears acceptable.
The Glucose Management Indicator, or GMI, estimates an HbA1c-like percentage from mean CGM glucose. It is not the same as a measured laboratory HbA1c and can differ because of red-cell conditions, recent glucose changes and other factors.
Higher TIR is associated with improved glucose outcomes, but no individual percentage guarantees that complications will never occur. Interpretation should include variability, time below range, laboratory results and the person’s health.
8. CGM Time in Range across four countries
The U.S. usually expresses glucose in mg/dL. The United Kingdom, Canada and Australia commonly use mmol/L. The familiar 70–180 mg/dL target band corresponds to approximately 3.9–10.0 mmol/L in these countries.
Diabetes UK emphasizes individualized goals and describes a common time-in-range aim of at least around 70% in 3.9–10.0 mmol/L. Australian diabetes education references likewise use this familiar adult band and emphasize the importance of time below range.
| Country | Typical target band | Common adult goal |
|---|---|---|
| United States | 70–180 mg/dL | >70% |
| United Kingdom | 3.9–10.0 mmol/L | About ≥70%, individualized |
| Canada | 3.9–10.0 mmol/L | Often ≥70%, individualized |
| Australia | 3.9–10.0 mmol/L | About ≥70%, individualized |
Canadian diabetes education integrates CGM targets and complementary measures of highs and lows. Access pathways and publicly funded device eligibility differ by healthcare system and, within Canada, by province.
Rather than comparing app screenshots without labels, include the original glucose units, target boundaries and reporting period when discussing CGM information internationally. Local clinical advice takes priority over a generic graphic.
9. Pregnancy, older adults and special targets
CGM targets must sometimes be individualized. For people with type 1 diabetes during pregnancy, commonly recommended time-in-range targets use a narrower glucose interval of 63–140 mg/dL (3.5–7.8 mmol/L), not the usual 70–180 mg/dL adult band.
Some older adults with complex or intermediate health have a more relaxed target of greater than 50% TIR, while keeping time below 70 mg/dL under 1%. These recommendations prioritize avoiding dangerous lows.
Gestational diabetes, childhood diabetes, chronic kidney disease, hypoglycemia unawareness and certain advanced treatments may require different guidance. A general CGM article cannot provide individual insulin targets or medication changes.
Your clinician can explain which reference band is appropriate and whether the CGM’s displayed target should be adjusted. The default app color scheme is not automatically the medically appropriate range for every patient.
10. Sensor lag, compression lows and missing data
CGM estimates interstitial rather than directly sampled plasma glucose. During a rapid change after a meal or treatment of low glucose, the sensor reading may lag behind a finger-stick measurement.
Compression lows may occur when body position presses on the sensor during sleep. Other technical problems, sensor start-up variation or a partially detached sensor can also influence data quality.
Use the manufacturer’s instructions to decide when to verify an unexpected reading with a finger-stick test. If someone has severe symptoms, do not delay necessary treatment while repeating sensor readings.
Missing days or hours can bias the distribution. A sensor worn mainly during waking hours may not reveal nighttime hypoglycemia. Assess wear time and patterns before treating a numerical TIR value as representative.
11. Safe ways to improve your CGM patterns
Start with the most clinically important pattern. If severe lows are occurring, discuss them promptly rather than focusing only on raising the percentage shown in green. Safety should guide every change.
Balanced nutrition, consistent meal timing where practical, appropriate movement, adequate sleep and medication adherence can all affect glucose. Keep a simple record of meaningful events to help your team interpret repeated highs or lows.
People using insulin pumps, multiple injections or automated insulin delivery should use a prescribed adjustment plan. Changing insulin independently to chase a CGM percentage can increase hypoglycemia or ketoacidosis risk.
A useful goal is gradual improvement in patterns while reducing dangerous excursions. Avoid obsessive checking or unrealistic perfectionism; a CGM is an information tool, not a report card on character.
12. FAQs about Time in Range
Is 70% TIR a good result? It is a common goal for many nonpregnant adults with diabetes, provided low-glucose safety goals are also met.
Does 80% TIR mean my HbA1c is normal? No. TIR and laboratory A1C measure different aspects of glucose exposure.
Can a single meter reading calculate TIR? No. TIR requires repeated observations across time.
What if my CGM reports a low while I feel normal? Follow the sensor instructions for confirmation and discuss recurrent discrepancies or low awareness with your care team.
Can I have dangerous lows with a good TIR percentage? Yes. Always review time below 70 and time below 54 mg/dL.
Why use 14 days of data? A longer monitoring interval with adequate sensor coverage usually better represents ordinary patterns.
Are U.S. and UK CGM targets completely different? The units differ, but 70–180 mg/dL approximately equals 3.9–10.0 mmol/L.
Does everyone with diabetes need CGM? Device use depends on clinical needs, treatment, access and professional guidance.
conclusion. Conclusion: Read the Entire CGM Picture
A useful time in range CGM report does more than provide one score. The percentage within target, the time spent dangerously low or high, the completeness of sensor data and the daily glucose pattern all affect what the report means.
For many nonpregnant adults, more than 70% between 70 and 180 mg/dL is a reasonable population goal. But personal safety, pregnancy, health complexity and hypoglycemia risk can change the appropriate target. Discuss significant patterns with the prescribing clinician.
Scientific References
- ADA 2026: Glycemic Goals, Hypoglycemia and Hyperglycemic Crises
- International Consensus on Time in Range
- Diabetes UK: Time in Range
- Diabetes Canada: Clinical Practice Guidelines
- Australian Diabetes Educators Association: CGM Interpretation
- Diabetes Victoria: Understanding Time in Range
- NIDDK: Clinical CGM Targets