Blood Sugar Levels Chart: Tests and Units
Blood Sugar Chart: Normal and High Levels

BBH Physical Health · Diabetes & Blood Sugar · Evidence-based glucose reference
Thank you for reading this post, don't forget to subscribe!A blood glucose report can seem more complicated than it should. One laboratory prints 5.8 mmol/L, another displays 104 mg/dL, and an HbA1c test reports 6.1%. Those numbers describe related aspects of glucose metabolism, but they are not interchangeable. Even the same number means something different when measured before breakfast, after a meal or during a formal glucose challenge.
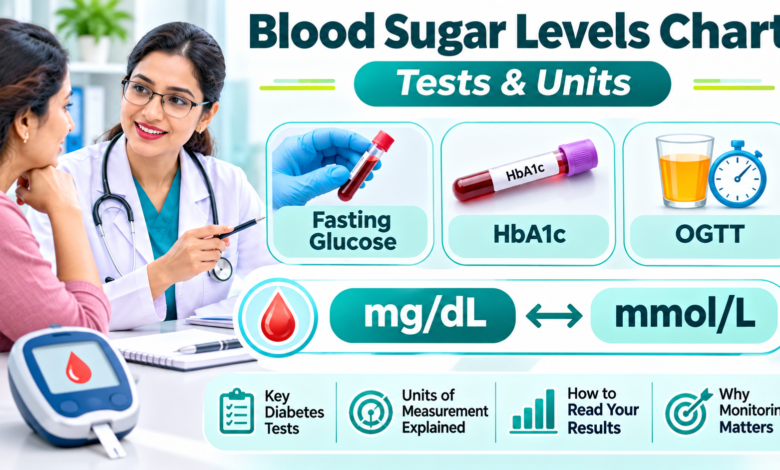
This blood sugar levels chart brings the common tests and units into one evidence-based guide. It explains the fasting plasma glucose and oral glucose tolerance ranges used to detect prediabetes and diabetes, how HbA1c differs, what common treatment targets mean and how to convert mg/dL into mmol/L.
The most important principle is context: diagnosis thresholds are not everyday treatment targets. Pregnancy, pediatric diabetes, older age, medications and individual risk can require different guidance. Use the tables as educational reference points, not as a substitute for your clinician’s interpretation.
1. Blood Sugar Levels Chart: Normal, Prediabetes and Diabetes
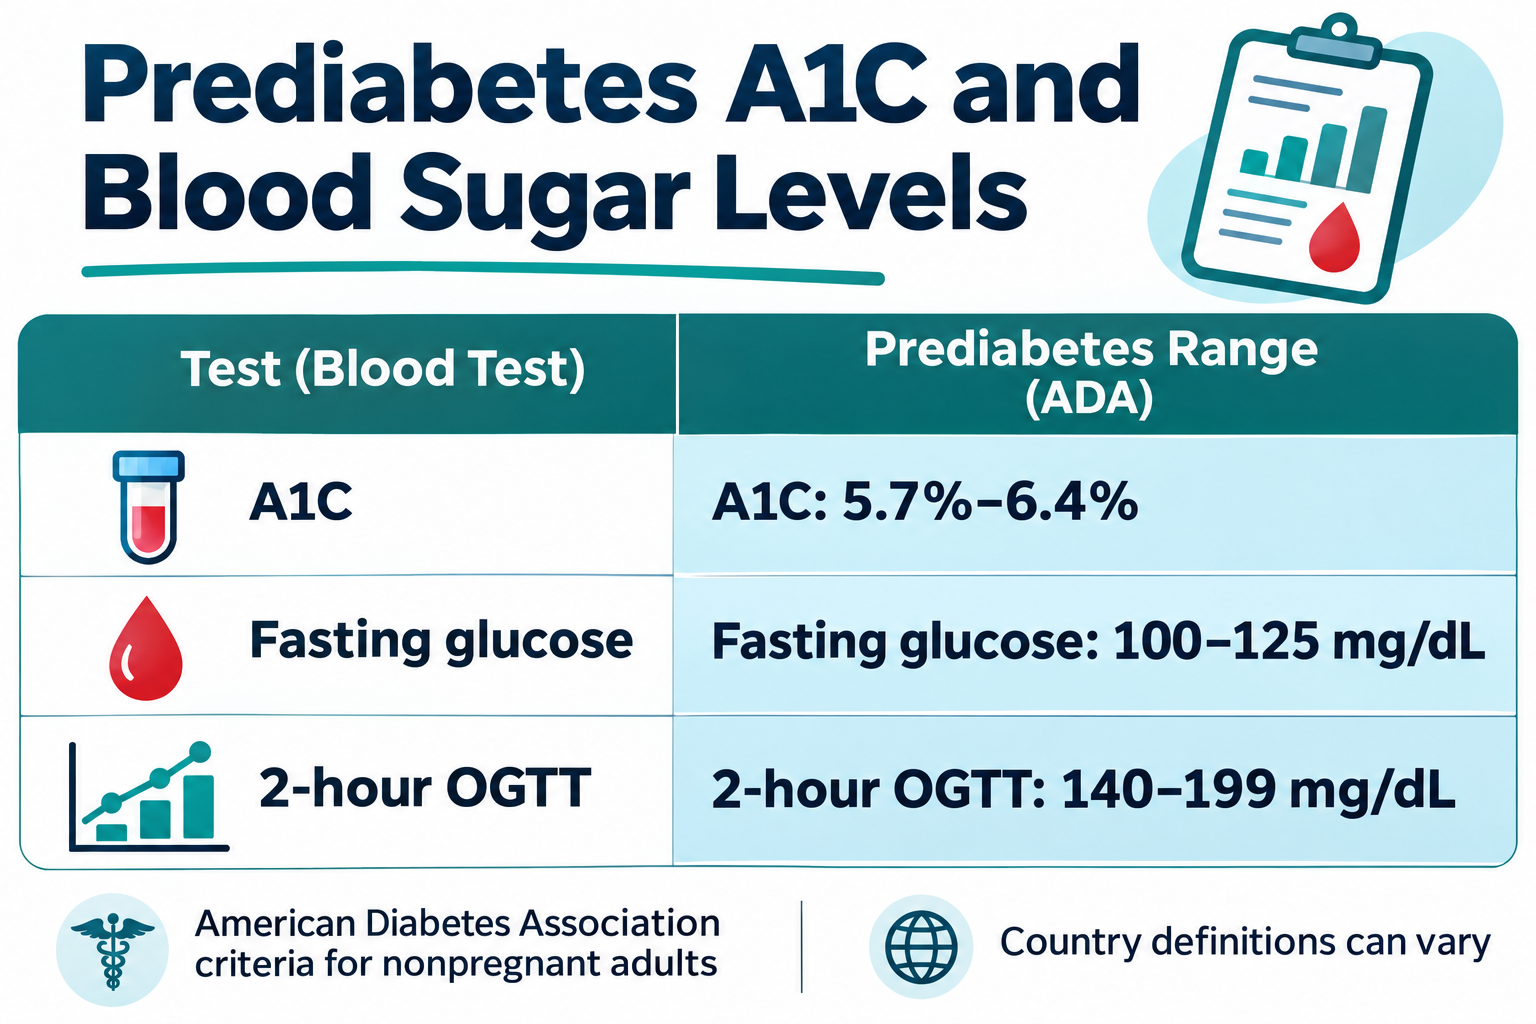
The following values are established ADA 2026 diagnostic thresholds for nonpregnant adults. Each row describes a different laboratory test performed under specified conditions. If you have more than one result, do not substitute one test’s threshold for another.
| Laboratory test | Normal | Prediabetes | Diabetes |
|---|---|---|---|
| Fasting plasma glucose | Below 100 mg/dL (below 5.6 mmol/L) | 100–125 mg/dL (5.6–6.9 mmol/L) | 126 mg/dL or higher (7.0 mmol/L or higher) |
| 2-hour 75-g OGTT | Below 140 mg/dL (below 7.8 mmol/L) | 140–199 mg/dL (7.8–11.0 mmol/L) | 200 mg/dL or higher (11.1 mmol/L or higher) |
| HbA1c | Below 5.7% (below 39 mmol/mol) | 5.7–6.4% (39–47 mmol/mol) | 6.5% or higher (48 mmol/mol or higher) |
Fasting means no calories for at least eight hours. The OGTT number is measured two hours after a standard 75-gram glucose drink. HbA1c reflects longer-term glucose exposure rather than blood sugar at a particular hour. The units for HbA1c can be a percentage or mmol/mol, and neither is the same as mmol/L.
A random laboratory glucose test has a separate diagnostic role: a value of 200 mg/dL (11.1 mmol/L) or higher can establish diabetes when classic high-glucose symptoms or a hyperglycemic crisis are present. Without unequivocal hyperglycemia, a second qualifying abnormal result is generally necessary.
2. Blood Sugar Units: mg/dL vs mmol/L
Glucose is often reported in mg/dL in the United States and India. The United Kingdom, Canada and Australia commonly use mmol/L. These units describe the same blood glucose concentration in different ways. The correct conversion for glucose is approximately 18.018 mg/dL per mmol/L.
To convert mg/dL to mmol/L, divide the value by 18.018. To convert mmol/L to mg/dL, multiply by 18.018. Clinical reports often round, so a displayed conversion may differ slightly from a calculator’s additional decimal places.
| mg/dL | mmol/L (approx.) | Example context |
|---|---|---|
| 70 | 3.9 | Common hypoglycemia alert threshold |
| 80 | 4.4 | Example lower premeal management target |
| 100 | 5.6 | Prediabetes fasting threshold begins |
| 126 | 7.0 | Fasting diabetes threshold |
| 140 | 7.8 | OGTT prediabetes threshold begins |
| 180 | 10.0 | Example postmeal management target limit |
| 200 | 11.1 | OGTT diabetes threshold or symptomatic random criterion |
| 250 | 13.9 | Example high glucose reading requiring context |
A converted number does not change whether the sample was fasting, after a meal or during an OGTT. Nor does converting units make a home meter suitable for diagnosing diabetes. The measurement method and timing must remain attached to the value.
Why HbA1c mmol/mol is different
HbA1c may be reported in IFCC units of mmol/mol, such as 48 mmol/mol, while glucose concentration is reported in mmol/L. These look similar but represent fundamentally different measurements. Never multiply an HbA1c mmol/mol result by 18 to turn it into a blood glucose value.
A blood sugar levels chart is most useful when the test name, sample timing, measurement units and reference purpose remain visible together.
3. How to Read a Fasting Blood Sugar Chart
Fasting plasma glucose measures glucose in the bloodstream after an appropriate fast. It is often used during routine screening because the procedure is relatively simple. A reading below 100 mg/dL is within the ADA normal fasting range; values from 100 through 125 are in the prediabetes range, and 126 or above meets a diabetes threshold.
The distinction is useful but not absolute proof from one isolated result. A clinician may confirm an abnormal reading, compare it with HbA1c or select an OGTT. Illness, stress, medicines and preanalytic issues can affect blood glucose measurements.
For example, a fasting laboratory result of 112 mg/dL is approximately 6.2 mmol/L and falls in the ADA prediabetes range. By contrast, a result of 112 mg/dL after lunch cannot be labeled prediabetes using fasting criteria; the circumstances are different.
A fasting value of 126 mg/dL or higher is a diagnostic threshold, not an instruction to change medicines independently. If a report is close to a cutoff, ask the clinician whether repeat testing or another laboratory measurement is appropriate.
4. HbA1c Levels Chart: Understanding a Longer-Term Result
HbA1c measures the proportion of hemoglobin with glucose attached and generally reflects glucose exposure over roughly two to three months. The ADA classifies values below 5.7% as normal, 5.7–6.4% as prediabetes and 6.5% or higher as meeting a diabetes diagnostic threshold.
HbA1c does not require fasting, but it can misrepresent glucose under certain conditions. Anemia, altered red-cell survival, hemoglobin variants, pregnancy and certain kidney conditions may influence accuracy. A clinician may prefer plasma glucose testing when HbA1c is unreliable.
What does estimated average glucose mean?
Estimated average glucose, or eAG, translates an HbA1c percentage into an approximate glucose concentration. The commonly used relationship is eAG in mg/dL = 28.7 × HbA1c (%) − 46.7. This is a population-based estimate, not an actual meter reading or a guarantee that glucose stayed at one value all day.
| HbA1c | IFCC mmol/mol (approx.) | Estimated average glucose |
|---|---|---|
| 5.7% | 39 | 117 mg/dL (6.5 mmol/L) |
| 6.0% | 42 | 126 mg/dL (7.0 mmol/L) |
| 6.5% | 48 | 140 mg/dL (7.8 mmol/L) |
| 7.0% | 53 | 154 mg/dL (8.6 mmol/L) |
| 8.0% | 64 | 183 mg/dL (10.2 mmol/L) |
In this blood sugar levels chart, the eAG values help readers connect laboratory percentages with everyday glucose units. A person can still have important high or low episodes despite a seemingly reasonable average, making patterns and clinical context essential.
A blood sugar levels chart is most useful when the test name, sample timing, measurement units and reference purpose remain visible together.
5. OGTT and Random Glucose: Why Test Timing Matters
An oral glucose tolerance test assesses how the body handles a measured glucose load. For the standard nonpregnant adult 75-g OGTT, the two-hour plasma glucose result is below 140 mg/dL for a normal result, 140–199 for prediabetes and at least 200 for diabetes.
This result is not equivalent to checking two hours after an ordinary lunch. Food composition, glucose dose, timing and measurement conditions differ. A regular after-meal home test should not be assigned OGTT diagnostic cutoffs.
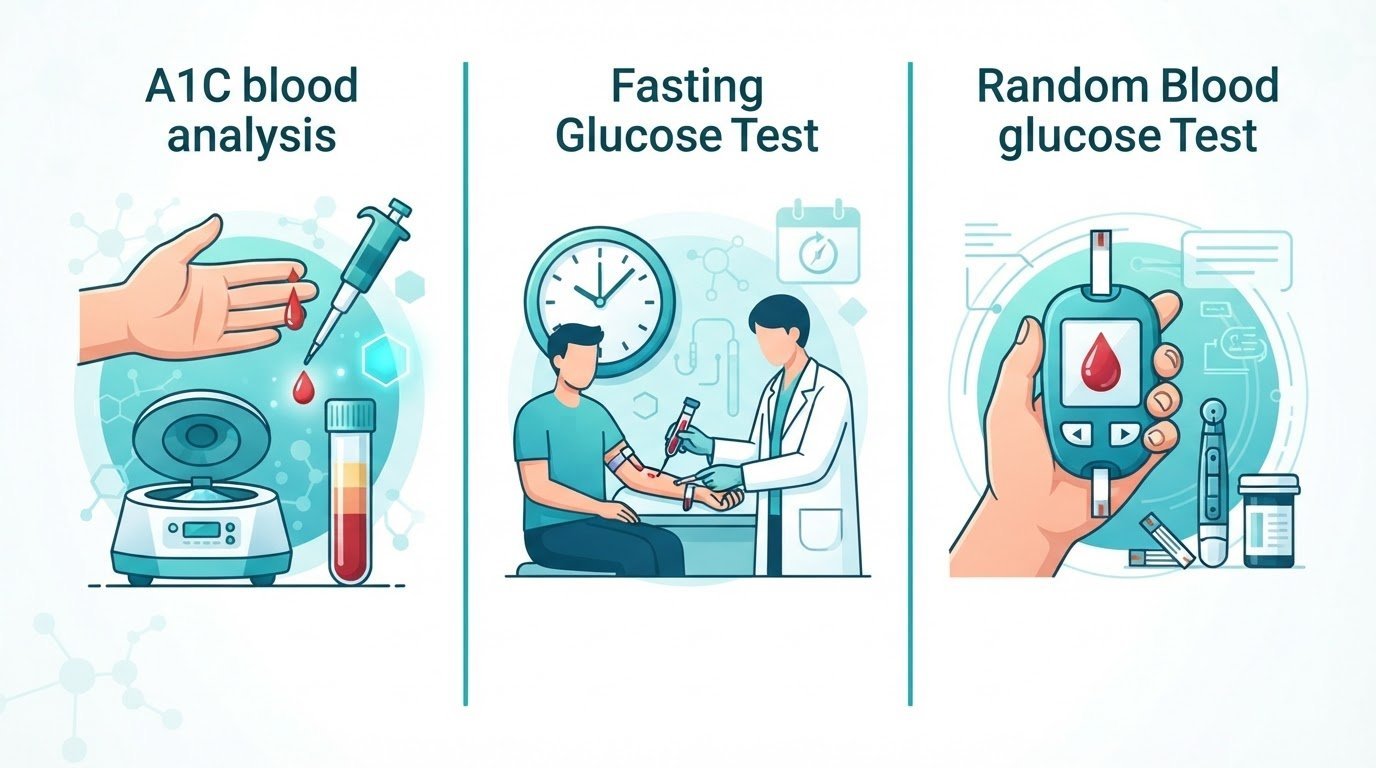
Random plasma glucose is taken regardless of the previous meal. The ADA allows a result of at least 200 mg/dL to establish diabetes when classic hyperglycemia symptoms such as excessive thirst or urination, or a hyperglycemic crisis, are present. Without that clinical context, follow-up testing is normally needed.
Visit Diabetes Diagnosis: Which Tests Are Used? for a fuller explanation of test preparation and why clinicians sometimes repeat results.
6. Blood Sugar Targets for People Who Already Have Diabetes
Diagnostic ranges answer whether diabetes may be present. Management targets answer what glucose range a person with established diabetes is aiming for during treatment. These must not be combined into one universal normal blood sugar chart.
The ADA 2026 standards give common targets for many nonpregnant adults: premeal capillary glucose of 80–130 mg/dL (4.4–7.2 mmol/L), peak postmeal glucose below 180 mg/dL (10.0 mmol/L), and an HbA1c target below 7% for many people when appropriate. Postmeal measurements are typically taken one to two hours after the start of eating.
| When measured | Example ADA target | Important context |
|---|---|---|
| Before a meal | 80–130 mg/dL (4.4–7.2 mmol/L) | Common nonpregnant adult target, not a diagnostic normal range |
| Peak after meal | Below 180 mg/dL (10.0 mmol/L) | Generally checked 1–2 hours after meal begins |
| HbA1c | Below 7% (below 53 mmol/mol) | Appropriate for many, not all, nonpregnant adults |
Older adults, people with recurrent low glucose, those who are pregnant or have significant other illnesses may need different goals. A treatment target is a joint decision with a healthcare professional, not a demand to push everyone to the lowest number.
7. Low Blood Sugar and High Blood Sugar: Numbers in Context
Low blood glucose can be dangerous, particularly for people taking insulin or certain glucose-lowering medicines. A widely used alert threshold is below 70 mg/dL (3.9 mmol/L); below 54 mg/dL (3.0 mmol/L) is considered clinically significant hypoglycemia. Severe hypoglycemia is defined by impairment requiring another person’s assistance, not merely by a numerical result.
Possible symptoms include shakiness, sweating, hunger, dizziness, confusion or unusual behavior. People with diabetes should follow their prescribed treatment plan for low glucose. A person who cannot safely swallow, has a seizure or becomes unconscious needs emergency help and should not be given food or drink by mouth.
On the high side, interpretation depends on timing, illness, known diabetes and symptoms. A high random meter reading cannot automatically diagnose diabetes. Marked thirst, increased urine output, vomiting, abdominal pain, deep breathing or confusion warrant appropriate clinical care.
For emergency warning signs, read Diabetic Ketoacidosis: Warning Signs.
8. Home Glucose Meters and CGM: How Readings Differ
Home glucose meters measure glucose from a small blood sample, while continuous glucose monitors estimate glucose in interstitial fluid. Both can be valuable for ongoing management, but neither is automatically interchangeable with a laboratory diagnostic test.
CGM readings may lag blood glucose during rapid changes, and sensor accuracy can vary. Finger-stick confirmation may be recommended when sensor readings do not match symptoms or when the device instructions say to confirm.
Timing and trends matter. A reading just after a carbohydrate-rich snack, before exercise or during infection may differ from a fasting laboratory result. A CGM graph can show patterns that HbA1c alone cannot describe, including swings and nighttime lows.
Do not diagnose prediabetes from a few home meter readings or dismiss a concerning laboratory result because a single home measurement looks normal. If numbers disagree, discuss test technique, timing and confirmation with the care team.

9. Pregnancy, Children and Other Important Exceptions
Pregnancy has distinct glucose targets and screening methods. Gestational diabetes may be assessed using one-step or two-step protocols that do not simply reuse the nonpregnant OGTT chart above. Individuals with preexisting diabetes who become pregnant require personalized management and closer monitoring.
Children, adolescents and older adults may need different goals for treatment. The balance between preventing glucose complications and avoiding low glucose depends on diabetes type, treatment, development, daily activities and overall health.
Some populations may be screened earlier because of risk factors, and some people need glucose testing when HbA1c is less reliable. These nuances help explain why two reports that look similar can lead to different next steps.
The tables here are educational references for nonpregnant adults. They should not be used as an independent medication dosing chart or to judge the safety of a child or pregnant person’s results.
10. How to Understand Your Own Lab Report
Start by identifying the test name. Does the report say fasting plasma glucose, random plasma glucose, two-hour OGTT, HbA1c or a home glucose reading? Then check the printed units and whether the test was performed under the required conditions.
Next, compare only with the matching row in the chart. If a fasting laboratory result is 115 mg/dL, it is approximately 6.4 mmol/L and falls within the ADA prediabetes range. If HbA1c is 6.1%, that also falls in the ADA prediabetes range, but it describes a different measurement.
Ask whether confirmation is required, whether a health condition might affect the result and when repeat testing is appropriate. The ADA generally requires confirmation for diabetes diagnosis without unequivocal hyperglycemia. For results near a threshold, a clinician may choose follow-up within months.
If you have diabetes already, compare readings with the individualized target given by your care team, not necessarily the diagnostic definition of normal. The same glucose number may serve different purposes depending on when and why it was measured.
11. Common Blood Sugar Chart Mistakes to Avoid
- Using a fasting diagnostic threshold to interpret an ordinary post-lunch meter reading.
- Confusing HbA1c mmol/mol with glucose mmol/L.
- Treating the eAG derived from HbA1c as a real-time blood glucose measurement.
- Assuming a home meter or smartwatch reading can independently diagnose diabetes.
- Treating a management target such as 80–130 mg/dL as the normal fasting range for everyone.
- Ignoring symptoms because a single glucose value seems reassuring.
- Changing insulin or another medicine without an individualized clinical plan.
A reliable blood sugar levels chart must preserve the test type, units, sample timing and intended purpose. Removing any of these details may turn a helpful reference into a misleading one.
12. Frequently Asked Questions About Blood Sugar Levels
What is a normal fasting blood sugar level?
Under ADA diagnostic criteria for nonpregnant adults, a fasting laboratory plasma glucose below 100 mg/dL (5.6 mmol/L) is considered normal.
Is 110 mg/dL a sign of prediabetes?
If it is a properly collected fasting laboratory result, 110 mg/dL falls within the ADA prediabetes range. If it was measured after eating, the fasting interpretation does not apply.
What does 7.0 mmol/L mean in mg/dL?
Approximately 126 mg/dL. A fasting laboratory glucose at this level meets a diabetes threshold, generally requiring confirmation if hyperglycemia is not unequivocal.
Is HbA1c 6.5% the same as 6.5 mmol/L?
No. HbA1c 6.5% is approximately 48 mmol/mol, while 6.5 mmol/L is a glucose concentration of about 117 mg/dL. They measure different things.
What should glucose be two hours after a meal?
For many nonpregnant adults with diabetes, an ADA management target is below 180 mg/dL at the peak one to two hours after a meal begins. This is not an OGTT diagnostic threshold.
Can a normal HbA1c miss a glucose problem?
Sometimes. HbA1c and glucose tests may disagree, and certain blood or medical conditions interfere with HbA1c. A clinician can assess whether additional plasma glucose testing is needed.
What is the difference between mg/dL and mmol/L?
Both measure glucose concentration. Divide mg/dL by about 18 to obtain mmol/L; multiply mmol/L by about 18 to obtain mg/dL.
Can a single blood sugar reading diagnose diabetes?
Usually diagnostic confirmation is needed unless there are classic symptoms or a hyperglycemic crisis with a qualifying random laboratory plasma glucose result.
Conclusion: Read the Number With Its Test and Timing
The purpose of a blood sugar levels chart is not to reduce health to one number. Fasting plasma glucose, HbA1c, OGTT, random glucose and day-to-day monitoring each answer a different question. Correct units and timing help avoid misleading comparisons.
Use laboratory results with professional guidance, ask whether confirmation is necessary and follow individualized treatment goals if you already have diabetes. A useful chart provides context for safer decisions rather than serving as a self-diagnosis or medication adjustment tool.
Explore Related BBH Guides
For more detailed, evidence-based information, explore Time in Range: What Your CGM Shows (understanding glucose-monitoring patterns); Oral Glucose Tolerance Test: Explained (interpreting standardized diagnostic glucose tests).
Scientific References